Streaming network data pipeline
Creating a single source of truth in less than 3 weeks for axon studios.

“It’s one thing to connect the data, it’s another to tell the story. That’s what every executive wants, and systematik got that right away.
I mean this as the greatest compliment, my boss barely had any notes on the first dashboard draft, which never happens.”
The problems
- Their main streaming platform (Zype) was only reporting on 1 dimension at a time. It was not possible for them to see how many people from a specific region watched a specific show from a specific series.
- They needed to extract FAST (another streaming platform) data from an S3 bucket daily to get the remaining of their streaming data.
- We couldn’t find an ETL platform that would connect to zype.
- They only had the budget for one development sprint.
The solution
Fortunately, the stakeholders had a good idea of what they wanted. After a thorough discussion, we were able to build a detailed roadmap of how we would tackle this project.
Step 1
- Create a google cloud platform account
- create a dbt account
- create a fivetran account
- use fivetran where possible to load the data in BigQuery. We used it for mailchimp, S3 bucket, and google ads.
- Connect google analytics 4 to BigQuery
- Build a custom API integration to Zype (this was by far the most time-consuming task of this step)
- Data validation against platforms UI
Step 2
- Create a dashboard mockup to get approved by the client
- Transform google analytics 4, mailchimp, and google ads data. Fortunately, we have a ton of experience with those data sources.
- Transform zype and fast data to allow them to filter by any dimension combination.
- Build basic data & unit tests to ensure that data quality remains impeccable.
Step 3
- Connect the transformed data to the approved dashboard.
- Data validation
- Present to the client for final approval
The project was completed in three weeks, from the approval of our roadmap to delivery.
The results
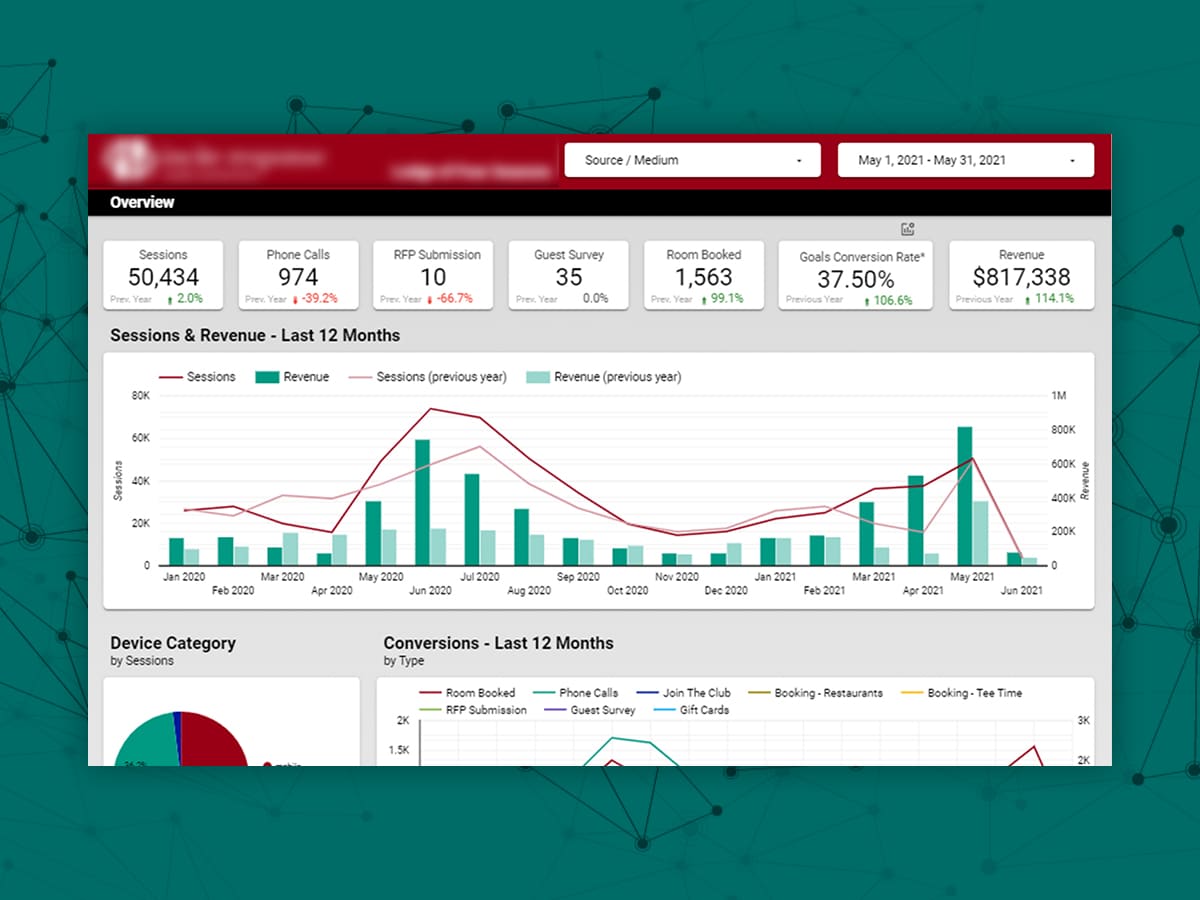
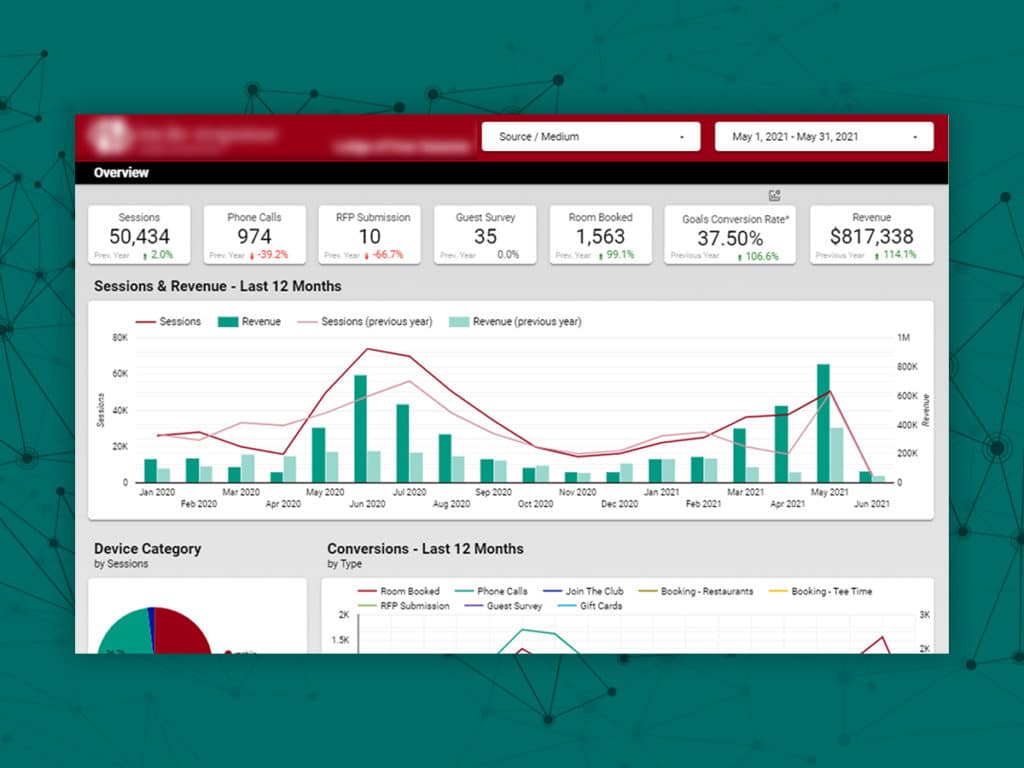
A fully automated looker studio dashboard that allowed them to analyze their KPIs in ways that were previously impossible. Most importantly, the dashboard saved them a combined 10 hours a week.
Don’t just take our word for it—axon studios’ team couldn’t be happier with the results. To hear it directly from them, watch the video testimonials provided by the head of production at axon studios.